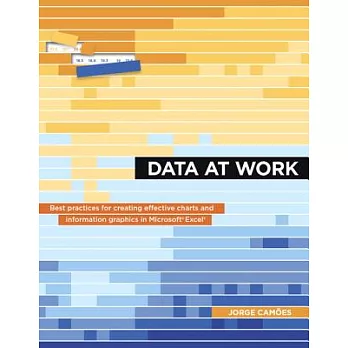
Information visualization is a language. Like any language, it can be used for multiple purposes. A poem, a novel, and an essay all share the same language, but each one has its own set of rules. The same is true with information visualization: a product manager, statistician, and graphic designer each approach visualization from different perspectives.
Data at Work was written with you, the spreadsheet user, in mind. This book will teach you how to think about and organize data in ways that directly relate to your work, using the skills you already have. In other words, you don't need to be a graphic designer to create functional, elegant charts: this book will show you how.
Although all of the examples in this book were created in Microsoft Excel, this is not a book about how to use Excel. Data at Work will help you to know which type of chart to use and how to format it, regardless of which spreadsheet application you use and whether or not you have any design experience. In this book, you'll learn how to extract, clean, and transform data; sort data points to identify patterns and detect outliers; and understand how and when to use a variety of data visualizations including bar charts, slope charts, strip charts, scatter plots, bubble charts, boxplots, and more.
Because this book is not a manual, it never specifies the steps required to make a chart, but the relevant charts will be available online for you to download, with brief explanations of how they were created.


 天天爆殺
天天爆殺  今日66折
今日66折 


 博客來
博客來 博客來
博客來 博客來
博客來 博客來
博客來 博客來
博客來